If you happen to be viewing the article Introduction to Double Bar Graph? on the website Math Hello Kitty, there are a couple of convenient ways for you to navigate through the content. You have the option to simply scroll down and leisurely read each section at your own pace. Alternatively, if you’re in a rush or looking for specific information, you can swiftly click on the table of contents provided. This will instantly direct you to the exact section that contains the information you need most urgently.
The most typical way to depict groups of data in graphs is with a double bar graph. Data from items based on two categories are represented and compared using this method. Typically, bar graphs are covered in the data analysis and interpretation component of competitive exams.To answer the questions one must be able to interpret bar graphs.For practicing double bar graph one could consult double bar graph worksheets.
Double Bar Graph
The height of each bar gives information, helping the children notice which columns have more objects and which columns have fewer objects. Bar graphs also help children sort and organize information.
Contents
What is a Double Bar Graph?

Double Bar Graph
Bar graphs are a common visual representation. A bar graph is a graphical representation of data that uses lone bars of different heights.
A double bar graph is a visual representation of data that uses two parallel bars of varying heights. You can arrange the bars either vertically or horizontally. A double bar graph can be used to contrast two sets of data to visually compare and contrast between different sets of data using the double bar graph template.
How to Make a Double Bar Graph?
To create a double bar graph, follow these steps:
The Frankfurt annual high and low temperatures are shown in this table in degrees Celsius.
The number 26 is the highest value while 0 is the lowest. This graph should be scaled such that 1 unit equals 10 degrees Celsius.
Excel or other software programmes can be used to make a double bar graph. On a sheet of paper, it can also be completed manually.

Temperature- Month Bar Graph
In this instance, the y-axis displays the temperature in degrees Celsius, and the x-axis displays the yearly months.

Double Bar Graph
The key here reveals that the highest temperatures are displayed in red and the lowest in green.

A Double Bar Graph with a Key
The graph is described in the title.

A Double Bar Graph with Heading
Double Bar Graph Example:

Learning from Examples
Following are the double bar graph example-
Example 1. What sport do girls like to play?

Graph of Favorite Sports
Ans: Look at the graph’s pink-colored highest bar. The color of the bar indicates the girls’ preferred sports.
Then confirm that the value on the y axis represents the greatest value for any female favorite sport. Soccer is the top choice in this instance with 10 females making that choice, which is also the highest number on the graph of girls’ preferred sports.
So, Soccer is the answer.
Example 2. Observe the given graph and answer the questions below.

Graph of Sports played by Girls and Boys
1. What sport do girls prefer to play the most?
Ans: Basketball
2. Which sport do boys prefer the most?
Ans: Cricket
Double Bar Graphs Compare Multiple Bar Graph:

Double Bar Graphs Compare Multiple
Let’s see double bar graphs compare multiple bar graph-
-
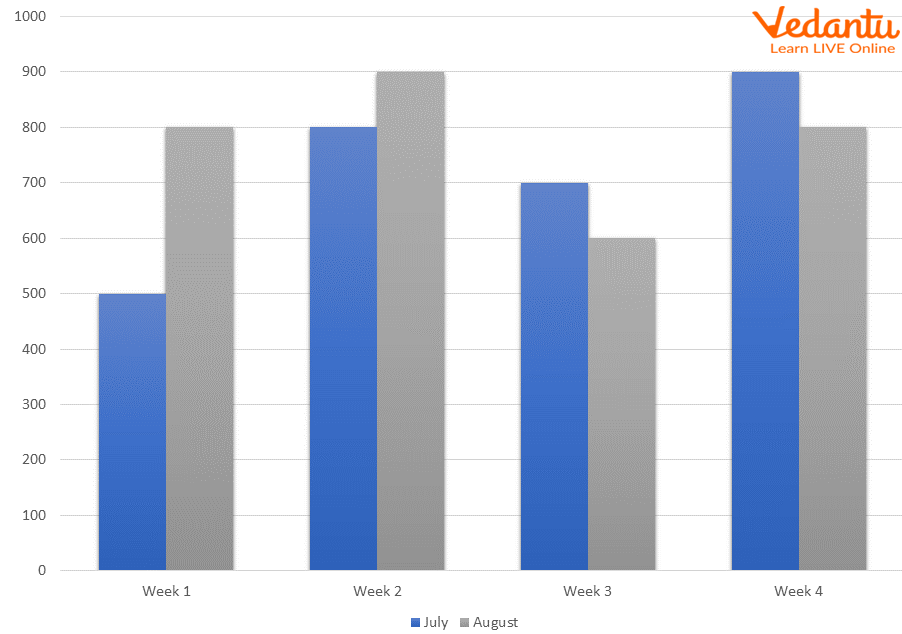
Double Bar Graph – A double bar graph is used to display two sets of data on the same graph. We would utilize a double bar graph, for instance, to compare the number of hours that students worked in one month to another.
-
Multiple Bar Graph – In a bar graph, there may occasionally be more than two sets of data to compare. A multiple bar graph can be utilized in that situation. Any number of data sets can be compared using a multiple bar graph.
Summary
Two sets of data are shown on the same graph using a double bar graph. We would employ a double bar graph, for instance, to compare the number of hours that students worked in one month to another.
The double bar graph worksheets demonstrate how to read a double bar graph to find data and address issues.
Thank you so much for taking the time to read the article titled Introduction to Double Bar Graph written by Math Hello Kitty. Your support means a lot to us! We are glad that you found this article useful. If you have any feedback or thoughts, we would love to hear from you. Don’t forget to leave a comment and review on our website to help introduce it to others. Once again, we sincerely appreciate your support and thank you for being a valued reader!
Source: Math Hello Kitty
Categories: Math